The VIX is a trademarked ticker symbol for the CBOE Volatility Index and is calculated by the Chicago Board Options Exchange (CBOE).
It represents one measure of the market’s expectation of stock market volatility over the next 30 day period and is often referred to as ”The Fear Gauge.
When the GFC hit, the VIX spiked to just less than 90. This week the VIX has hit a low of 10.3, a level not seen since 2014.
So what does all this mean?
It is an indication that market confidence is at a high level and may also indicate the market is becoming complacent with risk.
If we look at the VIX chart (See Fig 1 below) we can see that generally, when levels get low volatility can return and create a correction in the market.
Any bad news or “spooks” the market may experience could be even more devastating if the market is in a complacent state.
This would be because of the shock effect and sudden worry.
Keeping an eye on the index and any build up on the VIX could be a major advantage in your analysis of the market. You can access a VIX chart by clicking here or it may be available through your current trading platform.
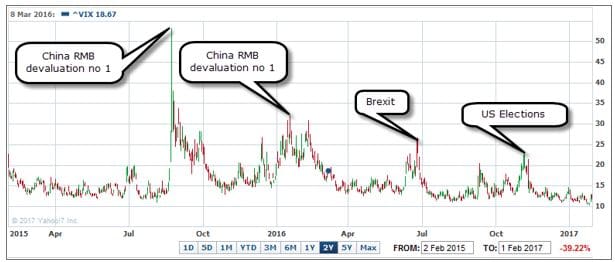
Fig 1
For further information on the VIX, please visit the following sites:
Chicago Board Options Exchange (CBOE)
Australian VIX (AVIX)
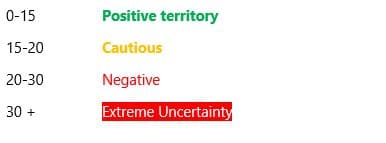
Australia has its own A – VIX and it is found on the ASX website (See Figure 2 below) which gives insight into investor sentiment by tracking the ASX200.
The A – VIX gives a “sentiment indicator” to help identify the certain stages of the market.
If you are interested in our trade mentoring program or the ShareSmart Stock market scanner please email us on support@equitysmart.com.au or call on 07 5609 7665.
